

by Don R. Campbell
Contributing Columnist
For More Follow Don at: Don R. Campbell’s “Signals vs. Noise”
Canadians hold three ballots and treat all three as equal. The real arithmetic says otherwise, and most voters are missing out on having an oversized impact.
Ask most Canadians which level of government affects their daily life the most and the answers come back fairly consistent. The safety of their community. What the property tax bill says. Where housing gets approved, and where it does not. Whether a bus runs down their street. How long the pothole stays. In other words Municipal Government.
However, their words do not match their actions. Here at “Signals vs Noise” we looked at the historic and current election turnouts and it revealed a strange anomaly and discovered that, for many, it is costing voters the opportunity to have the equivalent of 3 votes for their one… in ONE election.
Canadians vote at roughly twice the rate for the government that has the least to do with their daily life.
THE PATTERN SHOWS UP EVERYWHERE
In the 2025 federal election, 69% of eligible Canadians voted. It was the highest federal turnout since 1993.
Ontario’s provincial election in February 2025 drew 45.2%.
Toronto’s previous municipal election drew 29.7%. A figure we will be updating on Thursday this week when the latest municipal election numbers are confirmed.
That is not a story about one bad year or one dull race. It is not a trend in one direction. It is a gradient, and it holds across provinces that have nothing else in common. A measure of voter engagement.
For instance, Alberta held municipal elections in October 2025. Calgary’s voter participation came in at only 39.0%, down 7.3 points from the previous cycle. Edmonton came in at an even lower 30.4%, down 7.2.
That means, in Edmonton, 206,799 ballots out of 679,945 eligible voters decided the entire council. Two of every three eligible Edmontonians sat out the vote that sets their property tax rate, sets the safety agenda for their city, and shapes their daily life more directly than any other level of government.
Many of these non-voters will spend the next four years frustrated with how the city is run.
What is striking is that the direction of participation trend differs by province. Alberta’s municipal turnout fell sharply. British Columbia’s rose this month (October 2026). While, as shown in the graphic below, Federal turnout is climbing. None of that disturbs the pattern. Wherever you look, the closer a government sits to your front door, the fewer people show up to choose it.
BRITISH COLUMBIA OCTOBER 2026, IN DETAIL
B.C. just gave us an unusually clean test. Within nine days, the same electorate voted in two elections. Within eighteen months, the same electorate voted in three.
BC Municipal elections, October 17, 2026: 32.8% turnout province-wide. (a whopping 67.2% decided it wasn’t worth their time and allowed a small group of voters to decide for them)
BC Provincial election, October 24, 2026: 48.06%, on preliminary figures. 1,798,331 ballots from 3,738,182 registered voters. (that means 51.94% of British Colmumbians didn’t vote at either the many advanced polls or on election day)
BC Federal election, April 2025: 69.2% of eligible British Columbians.
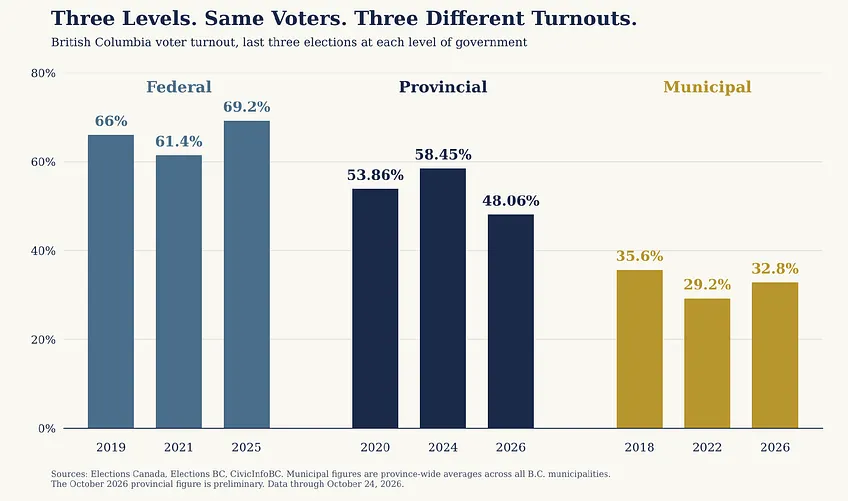
Go back through the last three cycles at each level and the three bands never once overlap:
Federal sits in the sixties every time: 66% in 2019, 61.4% in 2021, 69.2% in 2025. Provincial lands between 48 and 59: 53.86% in 2020, 58.45% in 2024, 48.06% this month.
Municipal runs between 29 and 36: 35.6% in 2018, 29.2% in 2022, 32.8% this month.
Same province. Same voters. Same decade. Three separate worlds.
B.C. federal turnout has never dropped below 61%.
B.C. municipal turnout has never reached 36%.
The two ranges have not come close to touching in a decade.
One more detail from this month’s BC elections deserves attention.
The BC provincial election was a “snap election”, called early by a majority government, in the province with the most acute housing affordability and healthcare problems in the country. It drew only 48.06% of eligible voters. That is lower than the 53.86% who voted in 2020, during pandemic restrictions, and more than ten points below 2024. Advance voting fell 11% against the previous election, reversing a decade-long upward trend.
An election consequential enough to be called early, and fewer than half the province’s voters took part.
ALBERTA’S NATURAL EXPERIMENT, October 2026
Alberta ran the cleanest version of this test anyone could have designed, and it ran it this month.
On October 19, Albertans voted in a province-wide referendum that included a question on beginning the legal process toward separation from Canada. It was covered in the media, in coffee shops and at dinner tables nationally and internationally for months. It asked about the province’s constitutional future. And it was completely non-binding, unlike Federal, Provincial and Municipal elections. Yet…
Advance and special-ballot voting alone reached 43.1% of Alberta’s electors. That is 1,356,873 ballots cast before referendum day had even begun.
Twelve months earlier, the same province held binding municipal elections. Calgary’s drew 39.0% of Calgary’s electors, start to finish. Edmonton’s drew 30.4% of Edmonton’s.
Put those side by side, each measured against its own electorate. A non-binding emotional question about a constitutional process in Alberta, that may never begin, reached a larger share of its voters in advance polls alone than two binding city elections managed in full.
Alberta’s referendum engaged 43.1% of the province’s electors BEFORE election day started. Calgary’s municipal election reached only 39.0% of its electors in total. Edmonton’s was even lower at 30.4%.
Albertans rejected the separation option by roughly three to one. But it’s the turnout, participation numbers that are the real story, not the result. The question that was emotional, but not legally binding, drew people out. The votes that set their property taxes, approve their housing, control the safety of their community and run their transit did not.
ONE BALLOT. THREE VOTES’ WORTH.
Here is the part that rarely gets discussed.
A vote is not a fixed unit. Its weight depends entirely on how many other people show up.
When turnout is 69%, roughly seven in ten eligible people have spoken, and your ballot is one voice among seven. When turnout is 32.8%, only one in three has spoken, and your ballot is carrying the weight of the two who stayed home.
Put precisely: at B.C.’s federal turnout, each ballot carries the weight of 1.45 votes. At provincial turnout, 2.08. At municipal turnout, a whopping 3.05.
Put less precisely: in a municipal election, it’s like getting three votes for the price of one.
And that is not a figure of speech. If every eligible British Columbian voted in a municipal election, your ballot would be one voice among all of them. Because only one in three turns up, your single ballot determines as much of the result as three ballots would at full turnout. Which is another reason to get out and vote every time, even if you don’t think it matters.
Here’s a chart you can right-click and share, or restack to your readers:
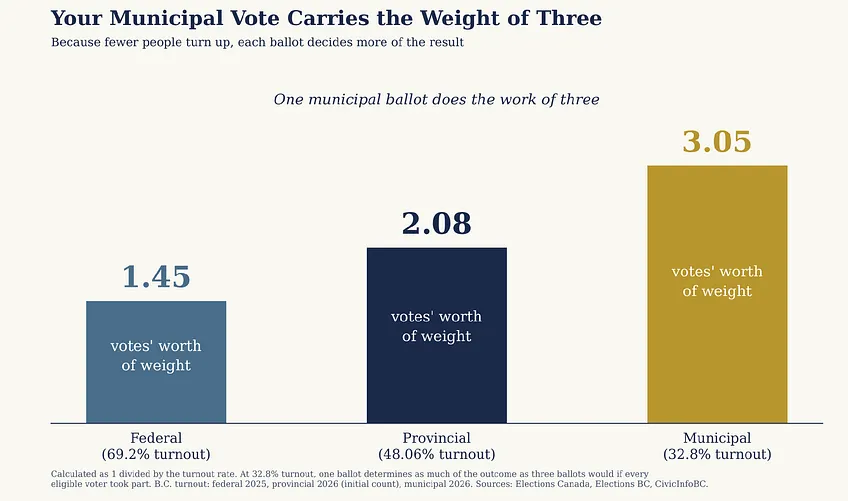
Your municipal ballot carries the weight of three votes.
A federal ballot, one and a half.
Most Canadians only turn up for the one with the least impact.
THE WINNING MARGINS MAKE IT REAL
Abstractions about vote weight are easy to wave away. Margins are not. Let’s use a real life example…
In this month’s B.C. provincial election, eighteen of ninety-three ridings were decided by fewer than a thousand votes. On election night: Burnaby South-Metrotown came down to 66 votes. Ladysmith-Oceanside, 89. Kelowna Centre, 132. Cowichan Valley, 150.
Sixty-six votes. In a riding of roughly forty thousand registered voters, a single apartment building’s worth of people decided who represents it.
Set that beside one other figure. Of 3,738,182 registered voters in British Columbia, 1,939,851 did not bother to cast a ballot.
Meanwhile, eighteen seats turned on fewer than a thousand votes apiece, which is at most about eighteen thousand votes in total. The people who stayed home outnumber every one of those margins by a factor in the hundreds.
Roughly 1.9 million British Columbians did not vote. The eighteen closest seats in the province were decided by a combined total of under 18,000 votes.
And those are provincial margins, where turnout was 48%.
Municipal races, at half that turnout, routinely turn on dozens of votes. The final council seat in a mid-sized city is often separated from the first candidate who missed it by a margin smaller than a large-school’s staff room.
The people who say their vote does not count are, statistically, most wrong about the election they are most likely to skip.
ONE HONEST COMPLICATION TO THE NORM
Not every municipal ballot is equally powerful, and the reason is structural in the way votes are allocated. Ward system vs City-wide voting.
Vancouver and Surrey elect their councils at large. Every voter in Surrey helps choose every councillor, from a pool of 134,437 ballots cast across the whole city. That pool is larger than any single provincial riding, so on raw influence over who wins a seat, the Surrey municipal vote is not more powerful than the provincial one. Its extra weight comes from turnout alone.
Ward systems work the other way. For instance, Edmonton’s twelve wards averaged roughly 17,200 votes each in 2025. That councillor was chosen by about a third as many people as a B.C. provincial riding, and well under a third as many as a federal one.
So the leverage is real everywhere, but it is strongest in ward cities. Worth knowing which kind you live in. If you live in a ‘Ward’ city, your vote carries even more weight.
THE BIG SPOTLIGHT
None of these ‘lack of participation’ requires reform, funding, or anyone’s permission.
The gap between 32.8% and 69.2% is not a structural flaw in Canadian democracy. It is a habit. It costs about thirty minutes, roughly every four years, and the ballot in question is the one that decides whether a building goes up near you, how your street gets maintained, what the bylaw says, and what you pay in property tax.
The levers people complain about most loudly at the federal level, housing supply chief among them, are substantially impacted at the municipal one. Zoning is local. Permitting is local. Development approvals are local.
A country can be frustrated with Ottawa and still be choosing not to use the one vote that moves the thing it is frustrated about.
WHAT TO WATCH
– When your municipality next votes, check its turnout against the 32.8% provincial average and the 29.7% Toronto figure. A city above 40% is doing something right, and it is worth knowing what. We’ll update on Thursday
– Watch the margins in your own ward or riding. If the last one was decided by a few hundred votes, the arithmetic is no longer theoretical; your vote would have carried serious weight.
Vote federally and vote provincially. That matters too.
But if you only have the energy for one trip to a polling station in the next four years, the data is unambiguous about which one buys you the most. Your municipal vote has more weight.
Coming up on Thursday’s edition:
Ontario voted on Monday, in the largest municipal elections in the country. Those numbers either confirm everything above or break it, and Alberta’s “official” referendum results land the same day. So watch for our Thursday Article delving into, not the results, but the turnout and participation. It will be an important litmus test.
Be Diligent. Be Strategic.
Leave a Reply